Page Google Analytics
Contact Us
Marketing and Communications3900 University Blvd.
Tyler, TX 75799
800 UT TYLER
Ph: 903.566.7170
Fx: 903.566.7173
web@uttyler.edu
Page Analytics Gadget
OU Campus Training and Support
With the Page Analytics Gadget, data tracked for analysis with Google Analytics is available within the UT Tyler OU Campus in the Gadgets sidebar. The data available is view and page specific.
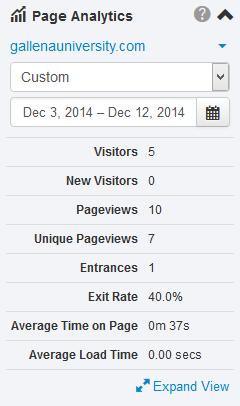
The following metrics are available for the Page Analytics Gadget:
- Visitors
- New Visitors
- Pageviews
- Unique Pageviews
- Entrances: The Entrances metric also does not have a chart, so no modal is displayed. For more information: Differences between Entrances and Sessions
- Exit Rate
- Average Time on Page
- Average Load Time: Provides the average of all of the measured page load times collected
over the specified period. There is no chart available for this metric.
Page Analytics Gadget (Expanded View)
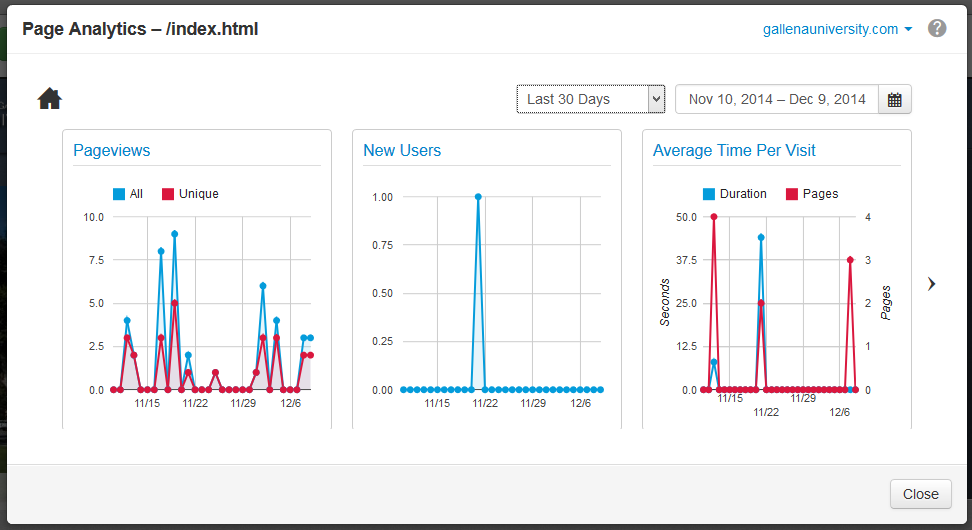
Using the Gadget
In the Page Analytics gadget itself, users can use the date range selectors to view data over a predefined or custom-defined amount of time.
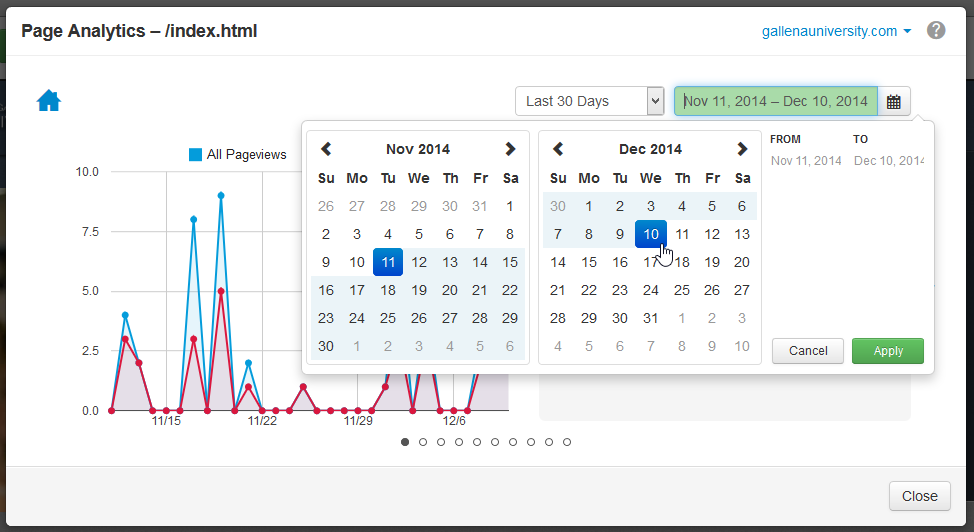
TIP: Edit the fields for specific dates. To take full advantage of Page Analytics,
always compare the numbers to previous years.
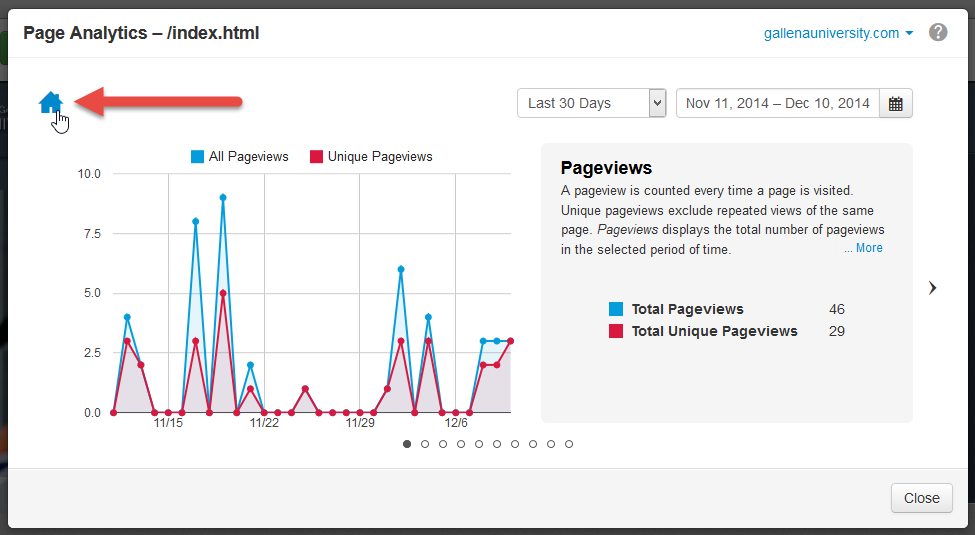
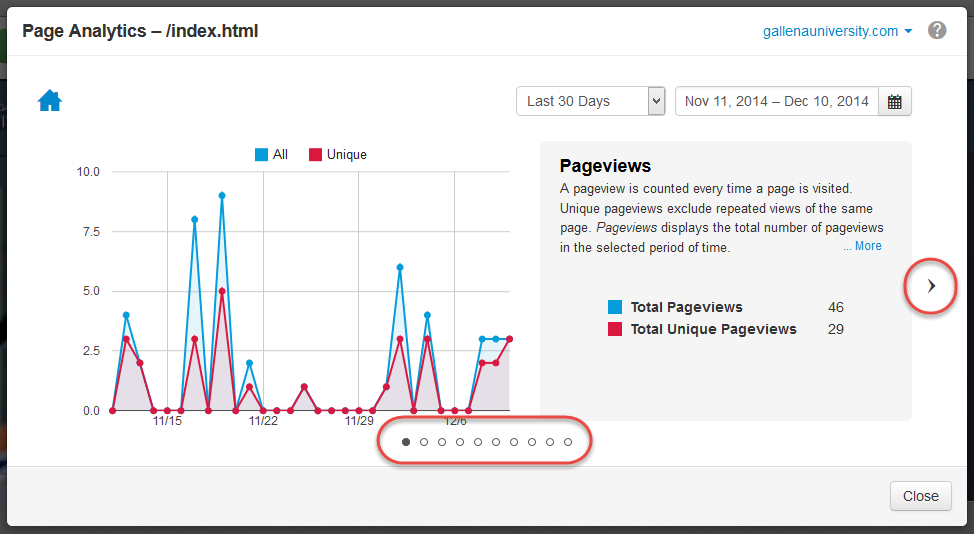
Clicking the Home icon will bring the user back from an expanded data group back to the overview, which shows thumbnails for all available data groups. The Home button will be visible in the overview, but it will not be clickable.
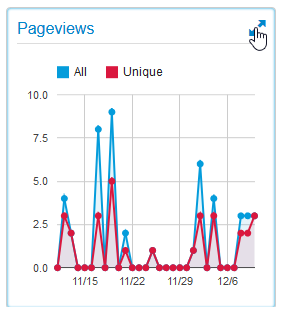
When viewing a thumbnail of a data group, hover over and click the expand icon to show the expanded view.
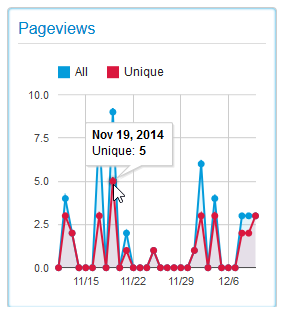
Hovering over a data point on a line graph, chart, map, or bar chart/list will show more details.
When browsing through expanded data groups or in the thumbnail view, navigation arrows and buttons are available to help the user navigate to different data groups.
For more details, see OU Campus Page Analytics Gadget documentation.
Contact Us
Marketing and Communications3900 University Blvd.
Tyler, TX 75799
800 UT TYLER
Ph: 903.566.7170
Fx: 903.566.7173
web@uttyler.edu